


Trends and charts
The TouchWin Editor offers a wide range of chart objects. We described the bar charts in chapter 4. Here we will now take a closer look at the trends and other charts. Here are the different charts according to their order on the panel menu.
- Real Trend Map - a real-time chart
- History Data Map - a chart that displays logged historical data
- X Y Chart - an XY chart
- X Y Curve - an extended XY chart
- Time Trend Control - no idea

Real Trend Map
This element is a real-time chart that displays a trend of the last X values of several variables as a ring buffer. The data is written immediately when the panel is switched on, regardless of whether the screen with the trend is visible or not. Data is therefore always available. Unlike other TouchWin trends, this trend does not have its own labeled scale. Various variables can be added to the trend and the variables can be configured individually as follows:
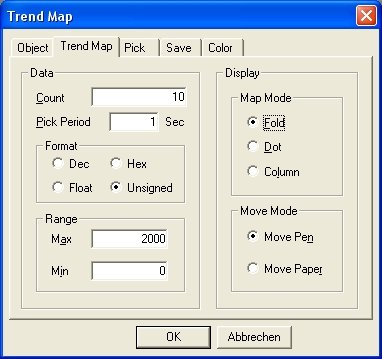 Count
Count
Count is used to specify for each pen how many elements of the variable the trend should represent; these elements are distributed evenly across the width of the trend.
Pick Period
The update rate for the pen, minimum is one second.
Format
The data type of the pen.
Range
Practical, a separate range can be specified for each pen.
Map Mode
The representation of the pen as a line, point or bar.
Move Mode
Specifies whether the pen starts from the left (Move Pen) or the right (Move Paper).
A trigger for the recording can be set via the Pick tab, and the data area in which the data is to be buffered can be set via Save. Color can be used to assign a color to each pen.
History Data Map
This element is a real-time chart with an additional ring buffer of historical data. Here you can see the current values of the pens and can also navigate into the past of the chart using a button. First we describe the configuration elements and then the navigation and table elements for display. You add pens as usual, each pen has its own value range. A value scale is not displayed in this chart either and can be created manually. A time axis is displayed instead. In the Display tab, you can make the most important settings next to Trend Source.
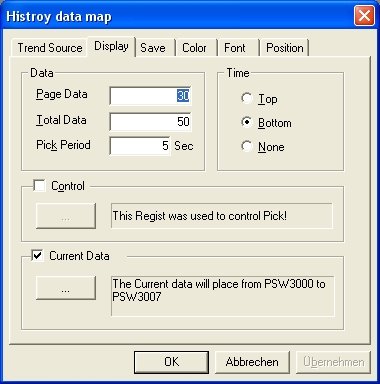
Page Data / Total Data
Under Page Data you can set how many values are displayed in the chart, under Total Data you can set how much data the trend buffers in total.
Pick Period
This is the time in which the trend is updated.
Control
Enables the trend and data collection to be stopped via a bit.
Current Data
Outputs the historical values for a pointer as an internal or external variable; the values are stored in the first register, followed by the timestamp. You can read how to move the point in the next section.
Page & Pointer
Although the historical trend is a dynamic real-time trend, you can navigate into the past in it. There are special buttons for this, which you can find in the panel menu as event buttons next to the trends. The event buttons offer the following options for historical trends under Trend/Event:
- Previous Page - navigates back one page, if 10 values are displayed as Page Data, you go back 10 values
- Next Page - navigates one page forward, also according to Page Data, when you reach the first page the trend is automatically updated again
- Previous Item - moves the pointer back one place, the tabs under Current Data change their content
- Next Item - moves the pointer one position forward, the tabs under Current Data change their content
- Reset - resets the trend completely and deletes the ring buffer
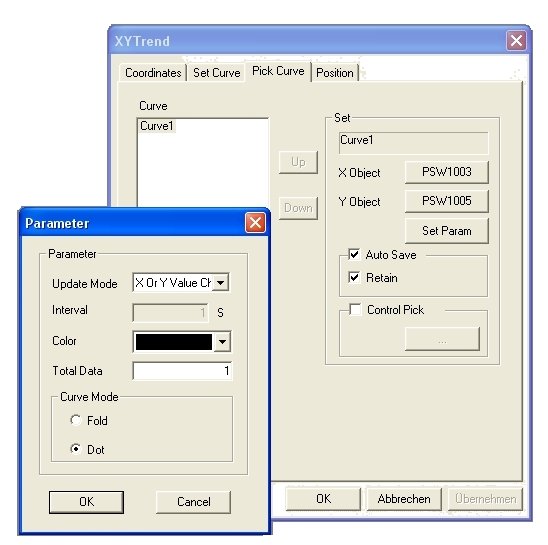
XY Trend
The WinTouch XY Trend is a dynamic XY diagram. You define the coordinate system under Coordinates. For a change, the XY trend has a labeled scale. Under Set Curve you can insert curves or points in different colors with fixed coordinates. Under Pick Curve you can add dynamic points or lines. The settings are made as follows:
Add / Del
Add new curve / point set. The buttons are hidden in the image to the right of the parameter window.
X Object / Y Object
The variable that contains the X-coordinate or Y-coordinate.
Set Param
Opens the parameter window.
Update Mode
In the parameter window. Defines when the values are updated, cyclically or when the value changes. Interval can be configured in the cyclical case.
Color
Defines the color of the line or point.
Total Data
Defines how many points should be displayed for this line or coordinate set. If you set the value to 1, only the current value is displayed as a coordinate.
Curve Mode
Display as a line or points.
XY Poly Map
The XY poly map is also an XY diagram. However, this chart draws the content of consecutive registers as an XY diagram. It can be drawn statically once or continuously adjusted using the Draw Mode "All Time" option. In contrast to the XY trend, however, it only ever shows current values. It can also be influenced via the event buttons for trends, e.g. a redraw can be triggered.
Time Trend Control
By far the most versatile trend. It generates its scales automatically and can be dynamically controlled in a variety of ways.
Common
Under Common, you specify whether the data is collected cyclically or by trigger. Storage Size defines the size of the memory for this trend and Storage Mode configures the trend either as a ring buffer (rotate overwrite) or deactivates it (full stop).
View
View defines the scaling of the chart and whether a grid should be superimposed. This is particularly useful for the zoom function using the event button.
Object
Under Object you will not find the data binding for the pens, but the memory address to save the data recorded by the trend.
Trend
This is where you configure the pens. Fold, Dot or Column defines the representation of the pen as a line, dot or bar. Pick defines the data source for the pen. The "Another Group" option determines whether this pen should have its own settings for scale, data type, etc., which you can find below.
Controlling the Time Trend Control via event buttons
The Time Trend Control Chart can also be controlled via event buttons. To do this, create an event button for charts and select one of the time trend functions. Here you can scroll the axes to the left and right or zoom in and out. Reset resets the chart.
